BP – South African trademarks
Updated 8 November 2026
BP is a UK-based global energy company. It produces and sells fuels and lubricants, including the Castrol brand.
How BP has built and protected its brands in South Africa – its trademark portfolio, where it expanded, how quickly its marks are registered, and who it competes with.
Download report (PDF)BP trademarks in 45 seconds

Watch the video on its own page, with transcript – https://snz.co.za/trademark-country-selection-direct/bp-south-african-trademarks/overview-video.html
A portfolio built over time
BP filed its first South African trademark in 1917 and has filed 1,028 since; its busiest year was 2000, with 199 new filings. The chart shows its filings per year from 1970.
Trademarks by filing year, up to 2024; applications still pending are not included.
The names behind the portfolio
Over the years the group has filed under several names – earlier company names, holding companies and subsidiaries. We count them together.
| Name | Marks | Filing years |
|---|---|---|
| BP | 1,038 | 1917–2023 |
Where BP expanded its business
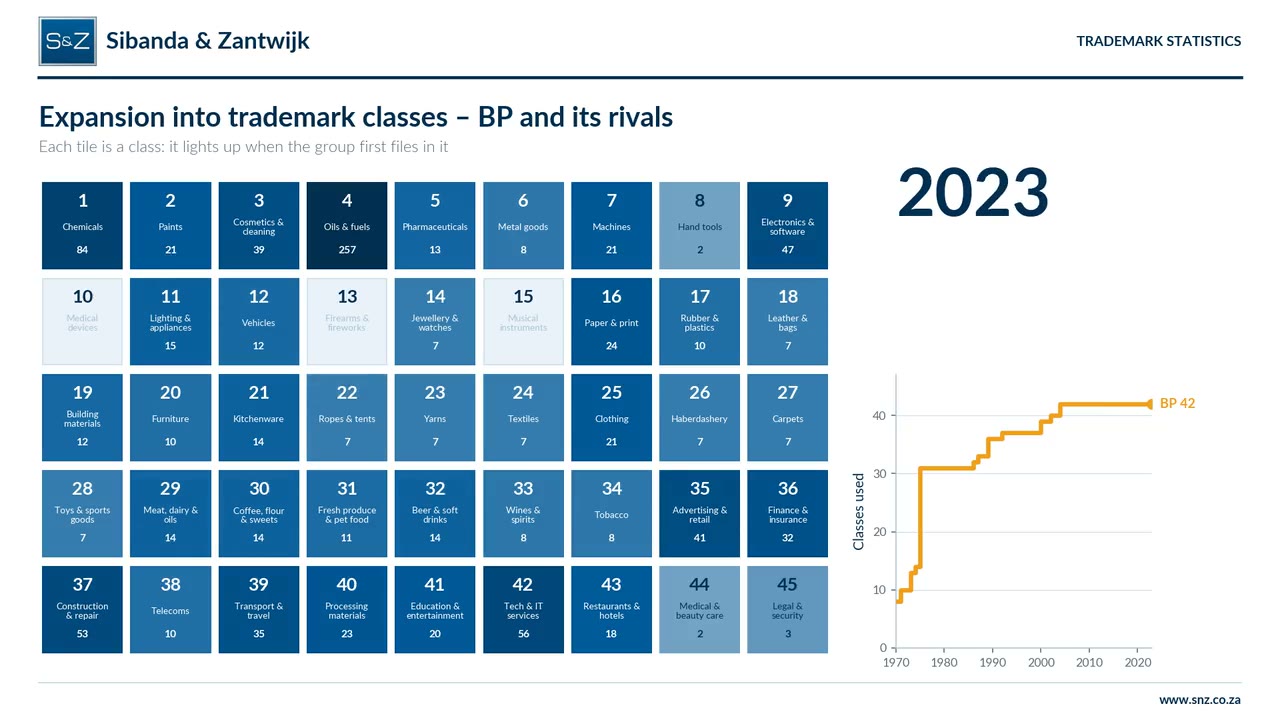
Trademark classes show what a business sells. BP's portfolio is concentrated in oils & fuels (class 4), chemicals (class 1), tech & it services (class 42). Its most recent moves were into medical & beauty care (2004), legal & security (2004), restaurants & hotels (2002).
BP trademarks: expansion into trademark classes, 1970–2023
Watch the video on its own page, with transcript – https://snz.co.za/trademark-country-selection-direct/bp-south-african-trademarks/class-expansion-video.html
Each tile is a class; it lights up when the group first files in it and darkens with more filings; the dots show how many of its closest rivals also file in that class. The chart compares the number of classes used with its rivals. The video runs from 1970; classes entered earlier are lit from the start.
| Class | Marks | Share | Since |
|---|---|---|---|
| 4 Oils & fuels | 257 | 25.0% | 1917 |
| 1 Chemicals | 84 | 8.2% | 1946 |
| 42 Tech & IT services | 56 | 5.4% | 1973 |
| 37 Construction & repair | 53 | 5.2% | 1973 |
| 9 Electronics & software | 47 | 4.6% | 1971 |
| 35 Advertising & retail | 41 | 4.0% | 1989 |
| 3 Cosmetics & cleaning | 39 | 3.8% | 1946 |
| 39 Transport & travel | 35 | 3.4% | 1989 |
The brands BP protects most
The word marks and logo names BP has filed most often – the same brand filed in more classes, in more versions or again over the years.
| # | Brand | Trademarks | Classes | Filed |
|---|---|---|---|---|
| 1 | BP | 150 | 39 | 1951–2018 |
| 2 | CASTROL | 53 | 29 | 1917–2023 |
| 3 | WILD BEAN CAFE | 46 | 11 | 2006–2022 |
| 4 | BEYOND PETROLEUM | 13 | 13 | 2003–2003 |
| 5 | ALTERNATIVENERGY | 12 | 12 | 2005–2005 |
| 6 | BP ALTERNATIVE ENERGY | 12 | 12 | 2005–2005 |
| 7 | BP CONNECT | 9 | 9 | 2001–2001 |
| 8 | BEYOND | 7 | 7 | 2005–2005 |
| 9 | PULSE | 6 | 6 | 2020–2020 |
| 10 | ADVANCING LOW CARBON | 5 | 5 | 2017–2017 |
| 11 | FRESH EXPRESSIONS | 5 | 5 | 1995–1995 |
| 12 | BP ULTIMATE | 5 | 4 | 2000–2010 |
| 13 | AIR BP | 4 | 4 | 1974–1983 |
| 14 | CASTROL DRILLCARE | 4 | 4 | 1997–1997 |
| 15 | FLUIDSMART | 4 | 4 | 2012–2012 |
Logos filed most often (since 2020)
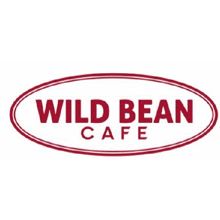

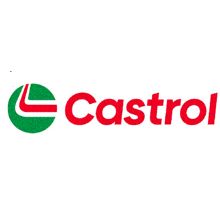




BP's logos
The 7 different logos BP has had published since 2020 – each logo shown once, however many classes or versions it was filed in. Logos protected in more classes come first.
How quickly its trademarks are registered
Over the last five years, BP's marks took a median of 3.5 years from filing to registration, slower than the market's 2.7 years. Most of that time is examination: 2.7 years from filing to acceptance (market: 1.9). Registration itself follows about half a year after acceptance.
Median years from filing to registration per registration year, split into examination (filing → acceptance) and acceptance → registration; the dashed line is the market median. A high recent value means older applications came through that year.
Who files the most in BP's classes
Ranked by number of trademarks filed in BP's main classes – any company that files there, whatever else it does (including retailers' own brands). This shows BP's market position, not who is most like it.
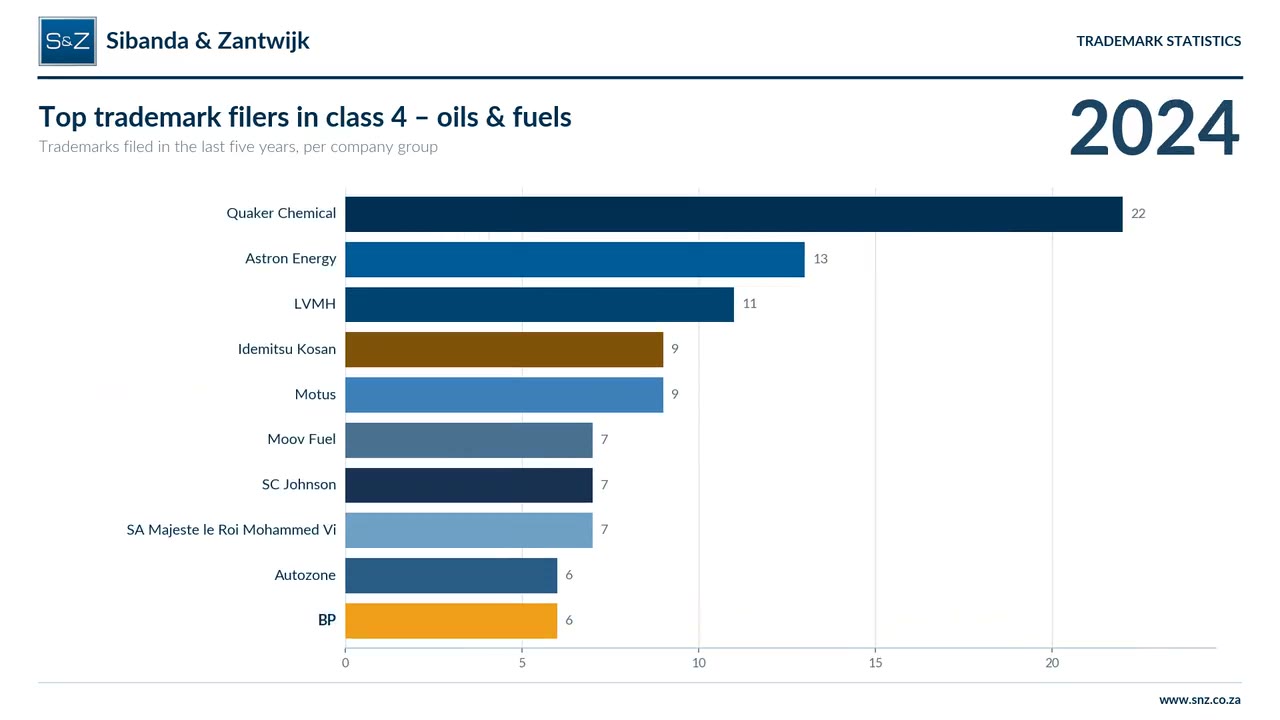
In the last five years, BP was #9 of 419 filers in class 4 (oils & fuels), with 6 of 714 trademarks; #76 of 947 filers in class 1 (chemicals), with 4 of 2,054 trademarks.
BP's share of all trademarks filed in each of its main classes, per filing year.
Top trademark filers in class 4 (oils & fuels), South Africa 1975–2024: BP
Watch the video on its own page, with transcript – https://snz.co.za/trademark-country-selection-direct/bp-south-african-trademarks/class-4-race-video.html
Main competitors – the companies most like BP
Ranked by how similar their whole trademark portfolio is to BP's – the same mix of classes and the same words in their marks – not by size. Large filers in its classes that do something different rank lower here.
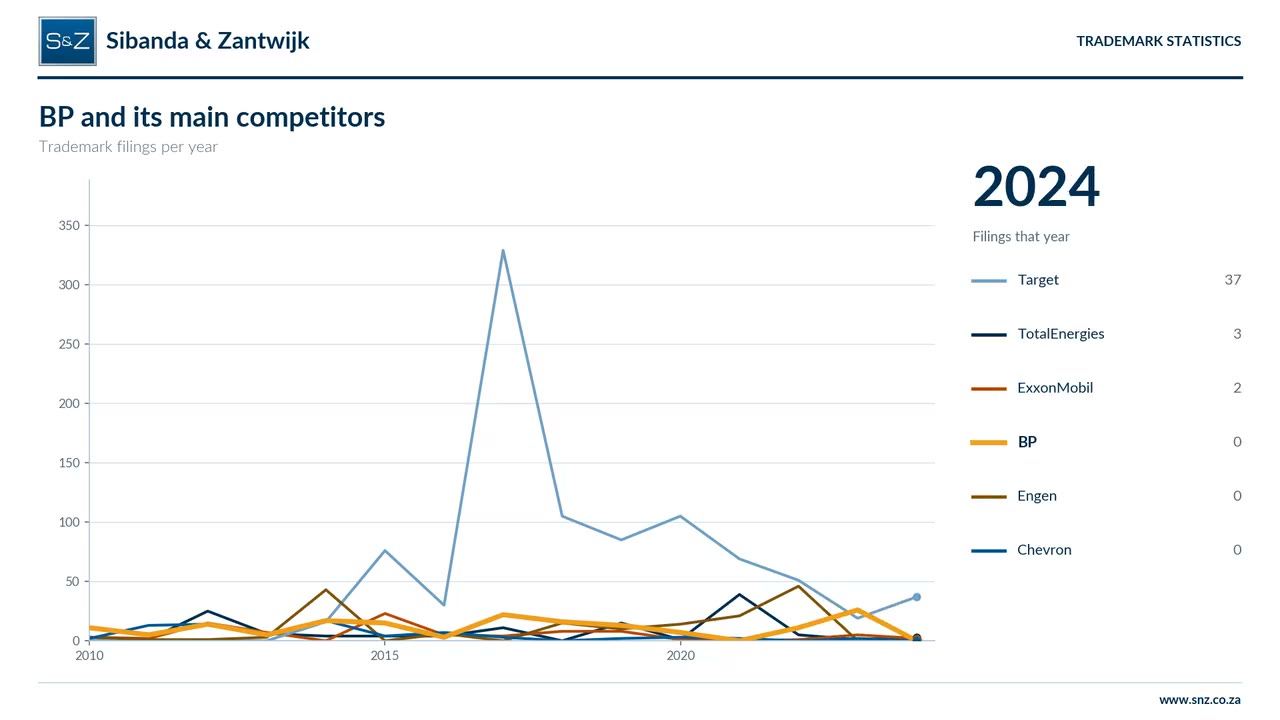
BP trademarks vs competitors: filings per year, 2010–2024
Watch the video on its own page, with transcript – https://snz.co.za/trademark-country-selection-direct/bp-south-african-trademarks/competitors-video.html
Trademark filings per year: BP (orange) and its five closest competitors.
| # | Company | Relationship | Similarity |
|---|---|---|---|
| 1 | TotalEnergies | – | 84% |
| 2 | ExxonMobil | – | 80% |
| 3 | Target | – | 74% |
| 4 | Engen | – | 66% |
| 5 | Chevron | – | 66% |
| 6 | Public Joint Stock Company Gazprom Neft | – | 66% |
| 7 | BMW | – | 62% |
| 8 | Quaker Chemical | – | 60% |
| 9 | Shell | – | 59% |
| 10 | Petredec | – | 58% |
Similarity of trademark activity since 2015 (classes and words used in marks). Retailers appear where their own brands compete on the shelf.
BP – relevant export countries
South Africa exported US$3.9 billion of the goods BP's main classes cover in the last year – lubricants; automotive; grease; lubricating oil (class 4); chemicals; fluids; brake fluid; coolants (class 1); software; batteries; battery chargers; computers (class 9); shampoos; fragrances; cleaning preparations; detergents (class 3). Combining where these goods are exported, imported, growing and made (and copied), and what protection costs, these are the markets where BP's trademarks matter most.
Adjust the weightings
These weightings decide how the countries below are ranked. Change any value and the others adjust to keep the total at 100%.
Worldwide
| # | Market | Score | SA exports | Import growth / yr | Route | Cost, 4 classes |
|---|---|---|---|---|---|---|
| 1 | European Union | 73 | US$321 m | -5% | National | US$2,123 |
| 2 | United States of America | 70 | US$132 m | +2% | National | US$2,750 |
| 3 | United Kingdom | 66 | US$42 m | -3% | National | US$1,192 |
| 4 | Japan | 63 | US$15 m | -2% | National | US$1,481 |
| 5 | Botswana | 62 | US$812 m | -17% | ARIPO | US$397 |
| 6 | Türkiye | 61 | US$18 m | +3% | National | US$1,119 |
| 7 | Zimbabwe | 60 | US$298 m | +123% | ARIPO | US$397 |
| 8 | Canada | 59 | US$4.6 m | -7% | National | US$1,907 |
| 9 | Singapore | 58 | US$34 m | -0% | National | US$1,725 |
| 10 | Hong Kong SAR | 58 | US$13 m | +2% | National | US$1,412 |
Africa
| # | Market | Score | SA exports | Import growth / yr | Route | Cost, 4 classes |
|---|---|---|---|---|---|---|
| 1 | Botswana | 62 | US$812 m | -17% | ARIPO | US$397 S&Z |
| 2 | Zimbabwe | 60 | US$298 m | +123% | ARIPO | US$397 S&Z |
| 3 | Nigeria | 58 | US$35 m | -24% | National | US$812 S&Z |
| 4 | Namibia | 57 | US$202 m | +3% | ARIPO | US$397 S&Z |
| 5 | Eswatini | 57 | US$281 m | -3% | ARIPO | US$397 S&Z |
| 6 | Tanzania | 56 | US$28 m | -4% | ARIPO | US$397 S&Z |
| 7 | Lesotho | 56 | US$249 m | -1% | National | US$320 |
| 8 | Mozambique | 56 | US$200 m | -17% | ARIPO | US$397 S&Z |
| 9 | Egypt | 55 | US$1.6 m | +18% | National | US$1,835 |
| 10 | OAPI (17 states) | 54 | US$24 m | -12% | National | US$1,378 S&Z |
SA exports = South Africa's exports of these goods to the market in the last year. Ranked with the default weightings. Score 0–100 from South Africa's exports of the goods to the market, net imports, import growth, foreign trademark filings, where the goods are made, market size and the cost of protection. Costs are total fees (official and professional) to file in 4 classes; ARIPO costs are per country, plus US$290 once per ARIPO application; S&Z = S&Z's own all-in price. Goods are taken from the classes and specifications, so the ranking is indicative.
Trade data: CEPII BACI (version 202601, trade flows 2022–2024), Licence Etalab 2.0; aggregated and combined with other data by S&Z.
Protecting its top brands in Nigeria and OAPI with S&Z
| Brand | Classes | Nigeria | OAPI (17 states) |
|---|---|---|---|
| BP | 39 | US$7,917 | US$7,842 |
| CASTROL | 29 | US$5,887 | US$5,995 |
| WILD BEAN CAFE | 11 | US$2,233 | US$2,671 |
| BEYOND PETROLEUM | 13 | US$2,639 | US$3,041 |
| ALTERNATIVENERGY | 12 | US$2,436 | US$2,856 |
S&Z all-in prices per brand in its number of classes, filing to registration.
TM Country Selection Rank the countries for your own goods and get the quotes.
Word marks you may have considered opposing
For BP's five most-filed brands: word marks of other companies (not BP's own group) that our similar word mark search, SimTM, found in the brand's own classes, and that we consider confusingly similar – from the earliest match found to today.
Similar to WILD BEAN CAFE (classes 4, 1, 42, 37, 9; searched 2018-04-25 to 2026-11-07)
No confusingly similar marks of other companies found in this period.
Similar to BEYOND PETROLEUM (classes 1, 4, 9, 37, 42; searched 2018-03-28 to 2026-11-07)
No confusingly similar marks of other companies found in this period.
Similar to ALTERNATIVENERGY (classes 1, 4, 9, 37, 42; searched 2018-06-27 to 2026-11-07)
No confusingly similar marks of other companies found in this period.
Similar to BP ALTERNATIVE ENERGY (classes 1, 4, 9, 37, 42; searched 2018-03-28 to 2026-11-07)
No confusingly similar marks of other companies found in this period.
Similar to CASTROL (classes 1, 4, 9, 37, 42; searched 2018-04-25 to 2026-11-08)
No confusingly similar marks of other companies found in this period.
Similarity of the words only. Whether a mark could have been opposed depends on the goods and services, the reputation of the brand and the facts – S&Z can advise. New marks like these are what SimTM watch reports as they are published.
How S&Z can help you
S&Z does not just file trademarks. We are a technology-first firm that manages trademarks – analysing your data, monitoring competitors and making sure your trademark assets remain protected.
We manage your trademarks – not just file them
Analysing your data, monitoring competitors and making sure your trademark assets remain protected:
Filing and renewal at fixed, all-inclusive prices
S&Z prices – South African trademarks
| Filing, first class – incl. official fee, examination report, routine office action, acceptance, publication, registration and e-certificate | US$240 |
| Each additional class of the same mark, filed at the same time | US$225 |
| Renewal online, per class (every 10 years from filing) | R1,027 ≈ US$62.29 |
Renewal in rand; US$ at R16.49 per US$.
BP's next five years of renewals
203 of BP's registered marks reach their ten-year renewal date in 2027–2031. Renewed online with S&Z, that costs about US$12,645 over the five years.
BP: frequently asked questions
What should BP consider for its trademarks?
- Where to file next: its goods sell strongly in Botswana, Zimbabwe and Nigeria – markets where South African exports of the same goods are large or growing, and where S&Z files at its own all-in prices (see “BP – relevant export countries”).
- Fewer new brands: new brand names fell from 1.4 to 0.8 a year – worth reviewing whether planned launches are being protected early enough.
- Renewals and use: keep track of the ten-year renewal dates and of marks that are no longer used – unused marks can be challenged after five years, and some may no longer be worth renewing.